Hi - I'm Alex! I've been teaching Maths in high schools since 2020, where I've gradually built up a passion for solving problems by writing my own code.
I recently come to the realisation that I want to make a career change, so I'm completing a B Computer Science at Western Sydney University. Here are some of the things that I've done over the years, that helped me to reach this point.
Each example below illustrates a solution that I created to solve some issue I came across in my job as a teacher. Many of them saved time in my day, or enabled the creation of teaching resources that I couldn't otherwise have feasibly created in a normal work day.
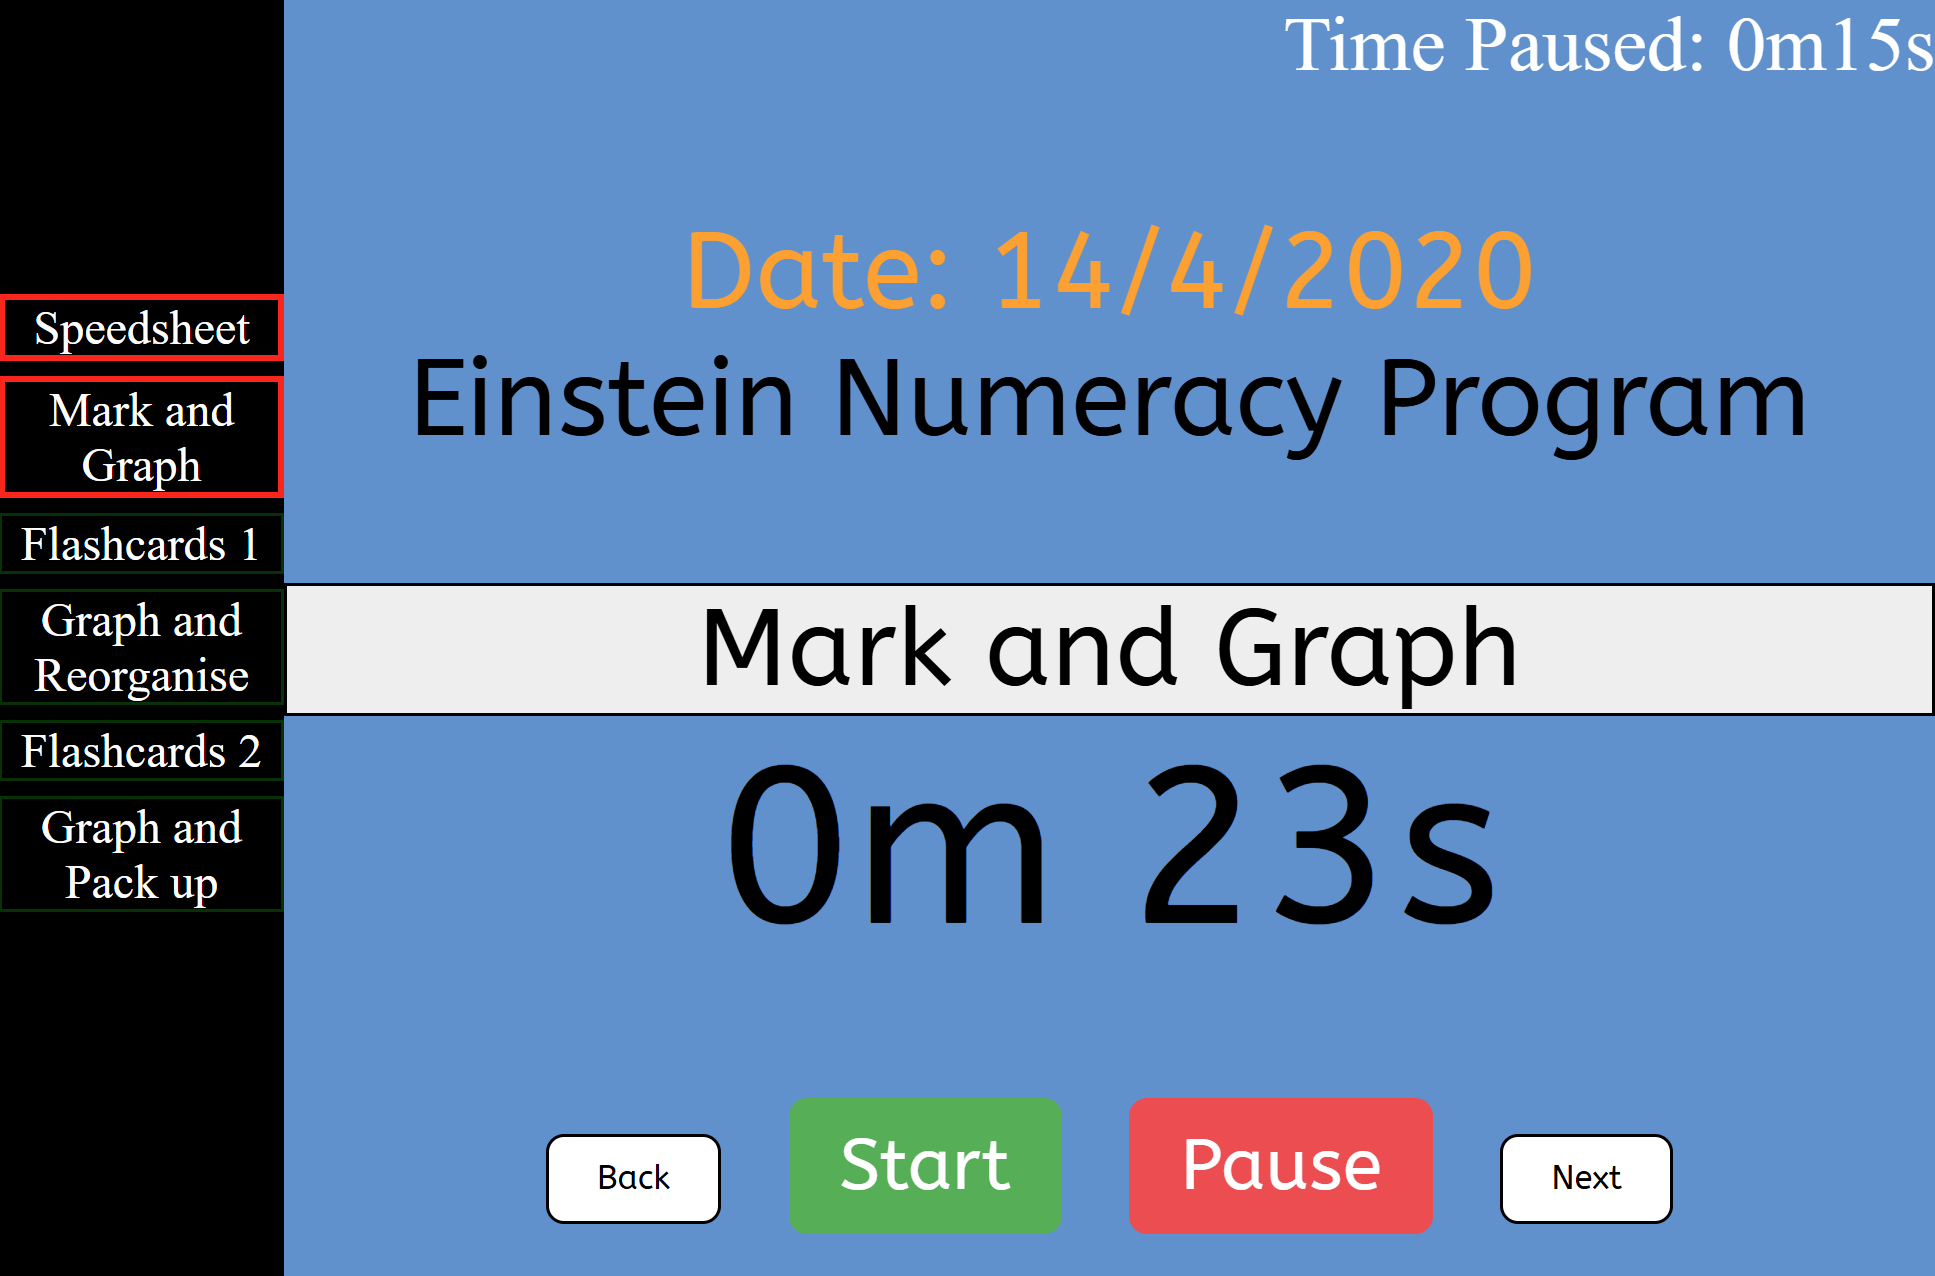
Einstein Timer (HTML/CSS/JS)
In 2020, I was lucky enough to teach a class that my school called the Einstein Class. This class:
- Had 60 students of mixed ability
- Was tought by 3 teachers working as a team
- Started with a routine flashcard activity every lesson
I loved teaching on this class, but I couldn't help noticing opportunities to improve our routine and help the class run more smoothly. I've given this example the longest write-up because it was a big turning point, when I realised that I could actually create a useful tool using code (and honestly, I'm still pretty proud of it).
The Problem
The flashcard activity was intensive and took a lot of time, where students had to:
- Complete a timed solo worksheet
- Mark their answers and graph their progress
- Partner up
- Drill a partner with a timed flashcard quiz
- Graph their progress
- Swap roles and quiz again
- Graph their progress
- Pack up and get ready for the lesson
More importantly, lots of time was lost between each step trying to organise the students, and crucially, one teacher had to stand by the computer, restarting the timer at every step.
The Solution
I created the Einstein Timer. This was my first attempt to create a working webpage, with everything coded from scratch in basic HTML, CSS and Javascript. The page accomplished the following things:
- Display the instructions visually for students
- Automatically move through activities and start timers
- Play a chime to signal the end of each activity
- Show the date for students to fill in on their sheets
- Allow teachers to pause the timer or skip activities
- Keep track of any "wasted time" from pausing to help with behaviour management
The timer worked well - I used it nearly every day for almost 2 years while teaching in that program. It freed up more time for teachers in the class and improved lesson timing with smoother transitions between activities.
Blooket Quiz Generation (Python)
I made frequent use of Blooket to engage students in basic Maths skill repetition by wrapping up the questions into a competitive game environment. The kids loved it, and they got loads of practice, answering way more questions than they would if they were just given worksheets or textbooks instead. If you're not familiar, here's a quick summary:
- Teacher creates a 'deck' of quiz questions
- Teacher then hosts a game on Blooket.com for students to join on their laptops
- Students gain points or some in-game progress for correct answers, and are penalised for incorrect answers
- The scoreboard is displayed on the teacher's screen, creating a very competetive and fun learning experience
The questions can be multiple choice, or require a typed answer. They are also shown in a random order, with most game modes allowing students to play at their own pace.
The Problem
Creating these quizzes takes time. The teacher has to come up with the questions, type in each question, its correct answer, and any incorrect answers. For Maths questions, this also means doing the necessary calculations to ensure the answers are correct, and that incorrect answers correctly capture calculation errors.
The end result: A quiz with 10 questions may take 30 minutes to create (if it has no images and requires only simple calculations). It's also difficult to represent some mathematical symbols, with the equation tools making the creation process even slower.
The Solution
So, technically, there is another option aside from using the site's quiz builder to create individual questions. Blooket also supports an option to import a .csv file containing the questions instead.
As soon as I realised this, I began creating my quizzes in Excel. This immediately came with the following benefits:
- Typing a questions into cells is significantly faster
- Formulas can be used to calculate the correct answer
- Small changes to the formula can target a common mistake for the other options
- Inputs can be randomised for rapid duplication of questions
This was a huge step up, but I wasn't quite satisfied. The formulas could become quite cumbersome and hard to read, and modifying a quiz for a different topic required entirely new formulas. I eventually wrote some Python code to help me get the job done faster.
Since .csv files are just text files containing commas, it
was incredibly simple to create some functions that would
output questions in the correct format. Here is my
utils.py which allows me to generate quizzes
using Python with just 3 functions:
-
setupSpreadsheet()- Adds the required first two rows of the template .csv file -
formatQuestion()- Provides the structure for defining a quiz question -
makeSpreadsheet()- Adds in all quiz questions and writes to the output .csv file
def setupSpreadsheet(f):
    strings = [
        '"Blooket\nImport Template",,,,,,,,,,,,,,,,,,,,,,,,,',
        'Question #,Question Text,Answer 1,Answer 2,"Answer 3\n(Optional)","Answer 4\n(Optional)","Time Limit (sec)\n(Max: 300 seconds)","Correct Answer(s)\n(Only include Answer #)",,,,,,,,,,,,,,,,,,'
    ]
    for string in strings:
        f.write(string)
        f.write("\n")

def formatQuestion(q='', a='', b='', c='', d='', dur='30', ans='1', typing=False):
    return f'1,{q},{a},{b},{c},{d},{dur},{ans},,{"typing" if typing else ""},,,,,,,,,,,,,,,,'

def makeSpreadsheet(questions=["n/a"], name="output"):
    with open(f'{name}.csv', 'w', encoding='utf-8') as f:
        setupSpreadsheet(f)
        for question in questions:
            f.write(question)
            f.write('\n')
The three functions in utils.py effectively
allow me to define my questions in Python, and then
automatically generate and output the corresponding .csv
file. This means that I can define and re-use questions
easily, with readable code that makes use of:
- Arithmetic operators
- Random number generation
- String manipulation
- Loops and arrays
Here's an example to show how this actually works:
Let's say I'm teaching financial mathematics, and my
students struggle to find the pre-tax price of an item
that includes GST. So, I a new file like
findPreGSTPrice.py, import
utils.py and create a blank list to hold my
questions:
import utils

questions = []
Next up, I define the question. Here is the first half of the question definition where I define and calculate all the values needed:
-
Using the
range()loop,Pwill effectively give us numbers 1 to 20 -
I treat
Pas the amount of GST - Then,
P*11is the sale price -
And
P*10is the correct pre-tax amount
Note: All four answers use the same value
of Q = 10 * P, but have different formatting
(dollar sign, number of decimal places). This will make
sense in a moment.
for P in range(19):
  P = P + 1
  text = f"Calculate the pre-tax price if the price including GST is ${P*11: .2f}"
  Q = 10 * P
  a = f"{Q:.2f}"
  b = f"{Q}"
  c = f"${Q:.2f}"
  d = f"${Q}"
The second half of the question definition
(still inside of the range() loop)
simply specifies the value for each column in the .csv and
the question type, before adding it to the list of
questions.
qholds the question texta,b,c,dhold the answer options-
The
ansvariable specifies that all four answers are correct -
typing=Truechanges the question type to require typed answers
Supplying four different 'correct' answers allows for variations in format. Even if a student forgets the dollar sign, or leaves off the cents for a whole number answer, I still want to reward them for the correct calculation.
 questions.append(
  utils.formatQuestion(
    q=text,
    a=a,
    b=b,
    c=c,
    d=d,
    ans='"1,2,3,4"',
    typing=True
  ))
The final line of code required, simply specifies the name of the output and creates the final .csv file:
utils.makeSpreadsheet(questions=questions, name="findPreGSTPrice")
This approach means that I can easily adapt question,
change values to adjust difficulty and generate huge
question sets in very little time. I can also add as many
different questions using
questions.append() as I like, to include
multiple question types into one quiz. Suddenly, I can
create a quiz with 100+ questions in under 10 minutes,
allowing students to practice their skills without
repeating questions often, and without me needing to spend
hours creating the quiz.
The last thing I added was a handy
characters.py file remove the need for
manually adding symbols or using the equation tools in
most cases. This lets me easily import the unicode
characters I need by name, including superscripts and
subscripts. Here is just a small sample of the symbols
that I commonly used from the file:
pi = "π"
box = "☐"
enDash = "–"
multiply = "×"
divide = "÷"
sqrt = "√"
theta = "θ"
Sports Carnivals (HTML/CSS/JS)
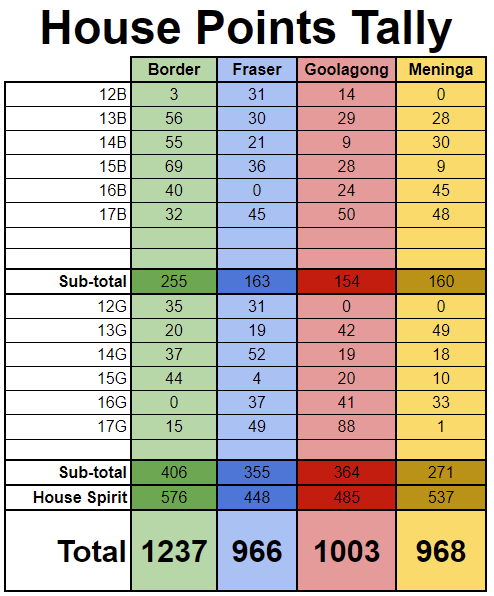
At the school I was working at, the Maths faculty would manage the record keeping and house points at each sports carnival. All of this was done using Excel Spreadsheets created by my predecessor at the school. I was volunteered to take on the job of updating and maintaining these spreadsheets every year.
The problem
- Outdated spreadsheets
- Broken formulas
- Lack of real-time feedback for students
- Only a single, local copy of the spreadsheet could be accessed by one person
The solution
This solution came about gradually, with a new iteration each carnival over 3 years.
Part 1 - Google Sheets and Live Scoreboard
I wanted to make it easier for multiple staff to access the spreadsheet, as well as being easier to use. Most staff had slightly more familiarity with Google Sheets, and Google sheets tended to run better on staff laptops than Excel, when handling larger sheets. My initial improvements:
- Switch from Excel to Google Sheets
- Overhaul sheets for consistent formatting and simpler maintenance
- Create a live scoreboard to visually show the house points
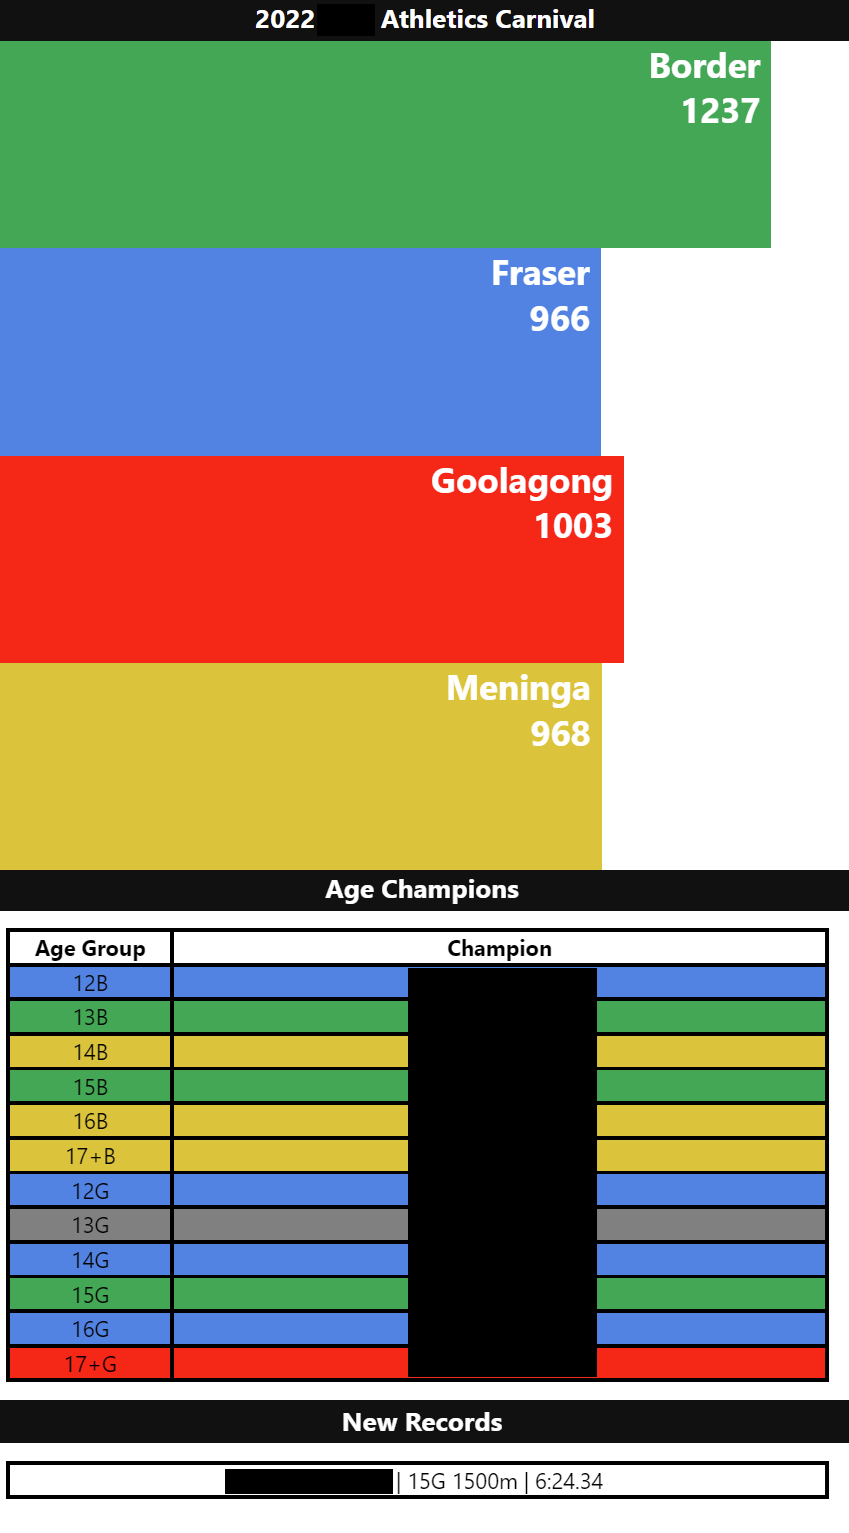
It became easier to work together with a colleague during the carnival, and we displayed the scoreboard on a large monitor that students could walk past and check. This had a huge impact on student engagement and was generally well received. Here's how it looked:
Part 2 - Google Apps Script
I really wanted to go one step further, and have students be able to access the scoreboard online. My first attempt:
- Create a Google Sheet containing only the scoreboard (to prevent access to student data)
- Import the necessary data from the full sheet via formula
- Post up QR codes linking to the scoreboard sheet
This worked, but left students battling with the Google Sheets UI on their mobile devices, and had limited information. So I went looking for a solution, and found Google Apps Script. After some time and a significant learning curve, I managed to:
- Create an appscript project using Javascript
- Use the Google Sheets API to import the necessary data
- Use HTML templating and CSS to build a mobile-friendly scoreboard
- Show point totals, age champions and broken records in real-time
The new scoreboard was publicly accessible via QR code and displayed well on both mobile devices, and our larger screen. The following image has been redacted to hide student names, but here is how the scoreboard looked: